Mandelbrot
I was inspired recently to do the thing that every programmer does: Implement the Mandelbrot set.
I’d been working with complex numbers and felt inspired to find a practical application to test my understanding. I opted to use Go since it’s a language I’m familiar with and it also has native support for complex numbers.
I used it to not just create the set itself, like this
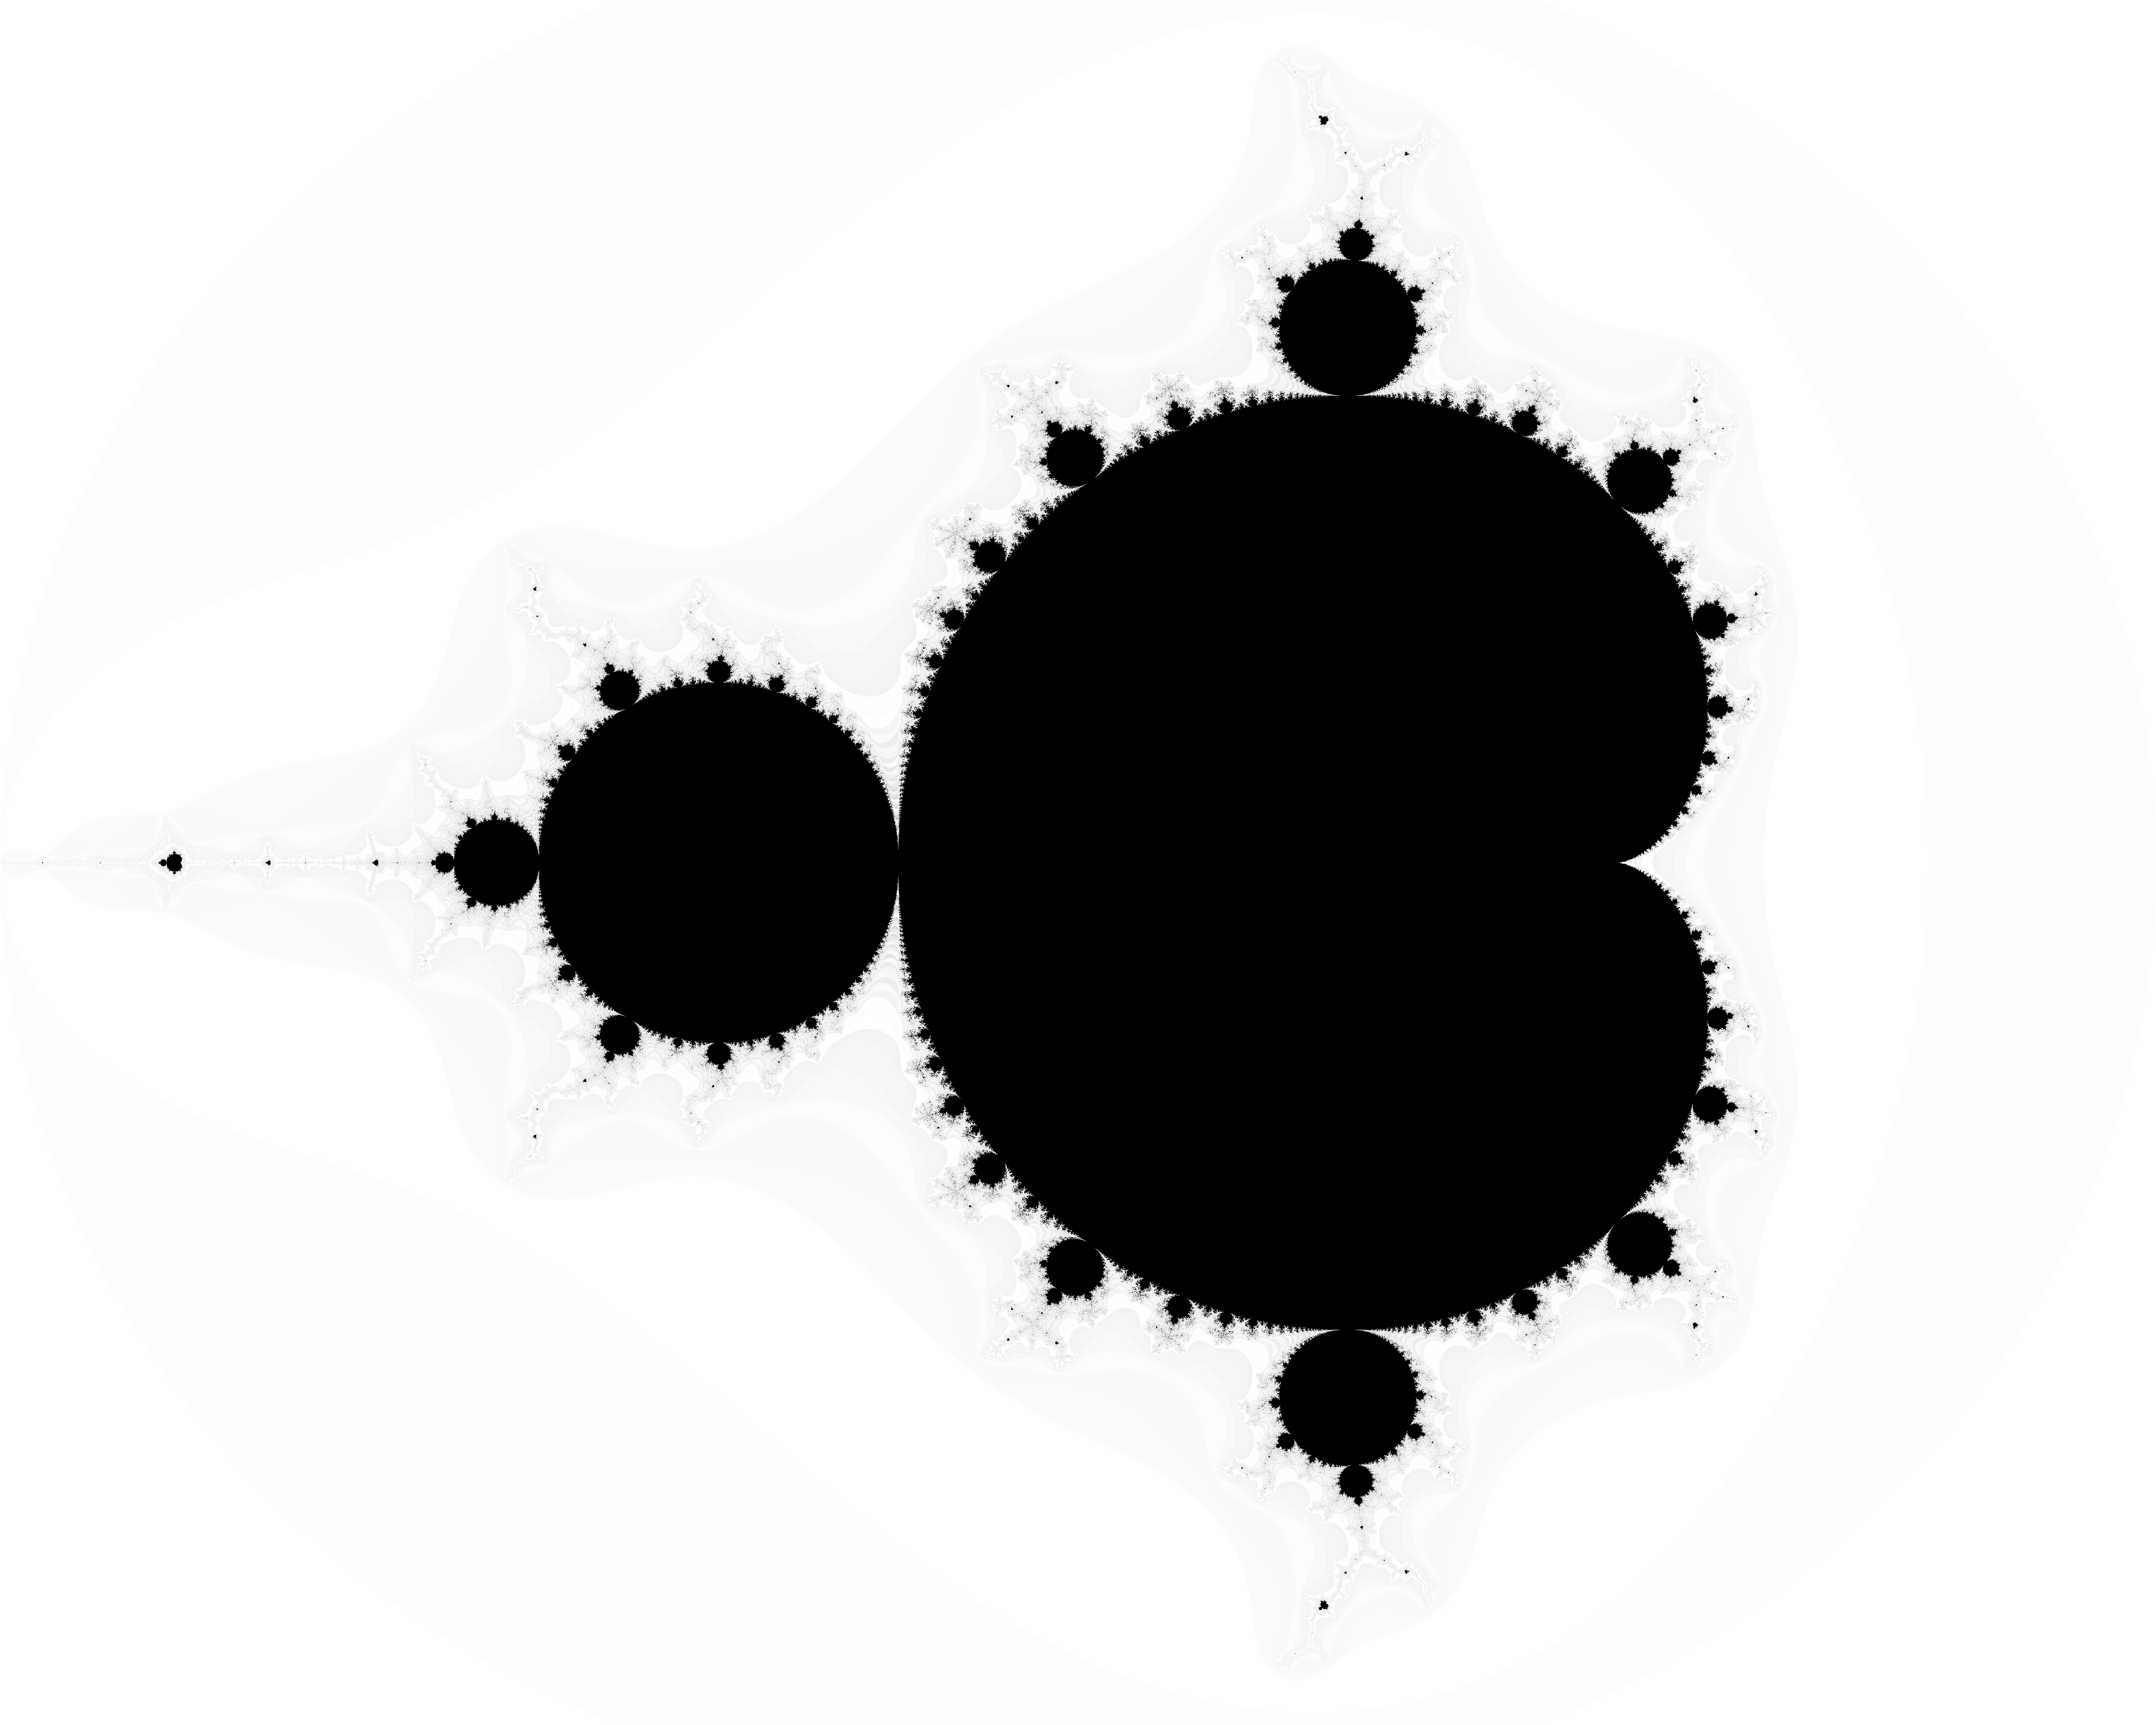
But also to animate it, both to show the process of resolving, increasing the number of times you iterate a given value be more sure of it’s hyperbolicity.

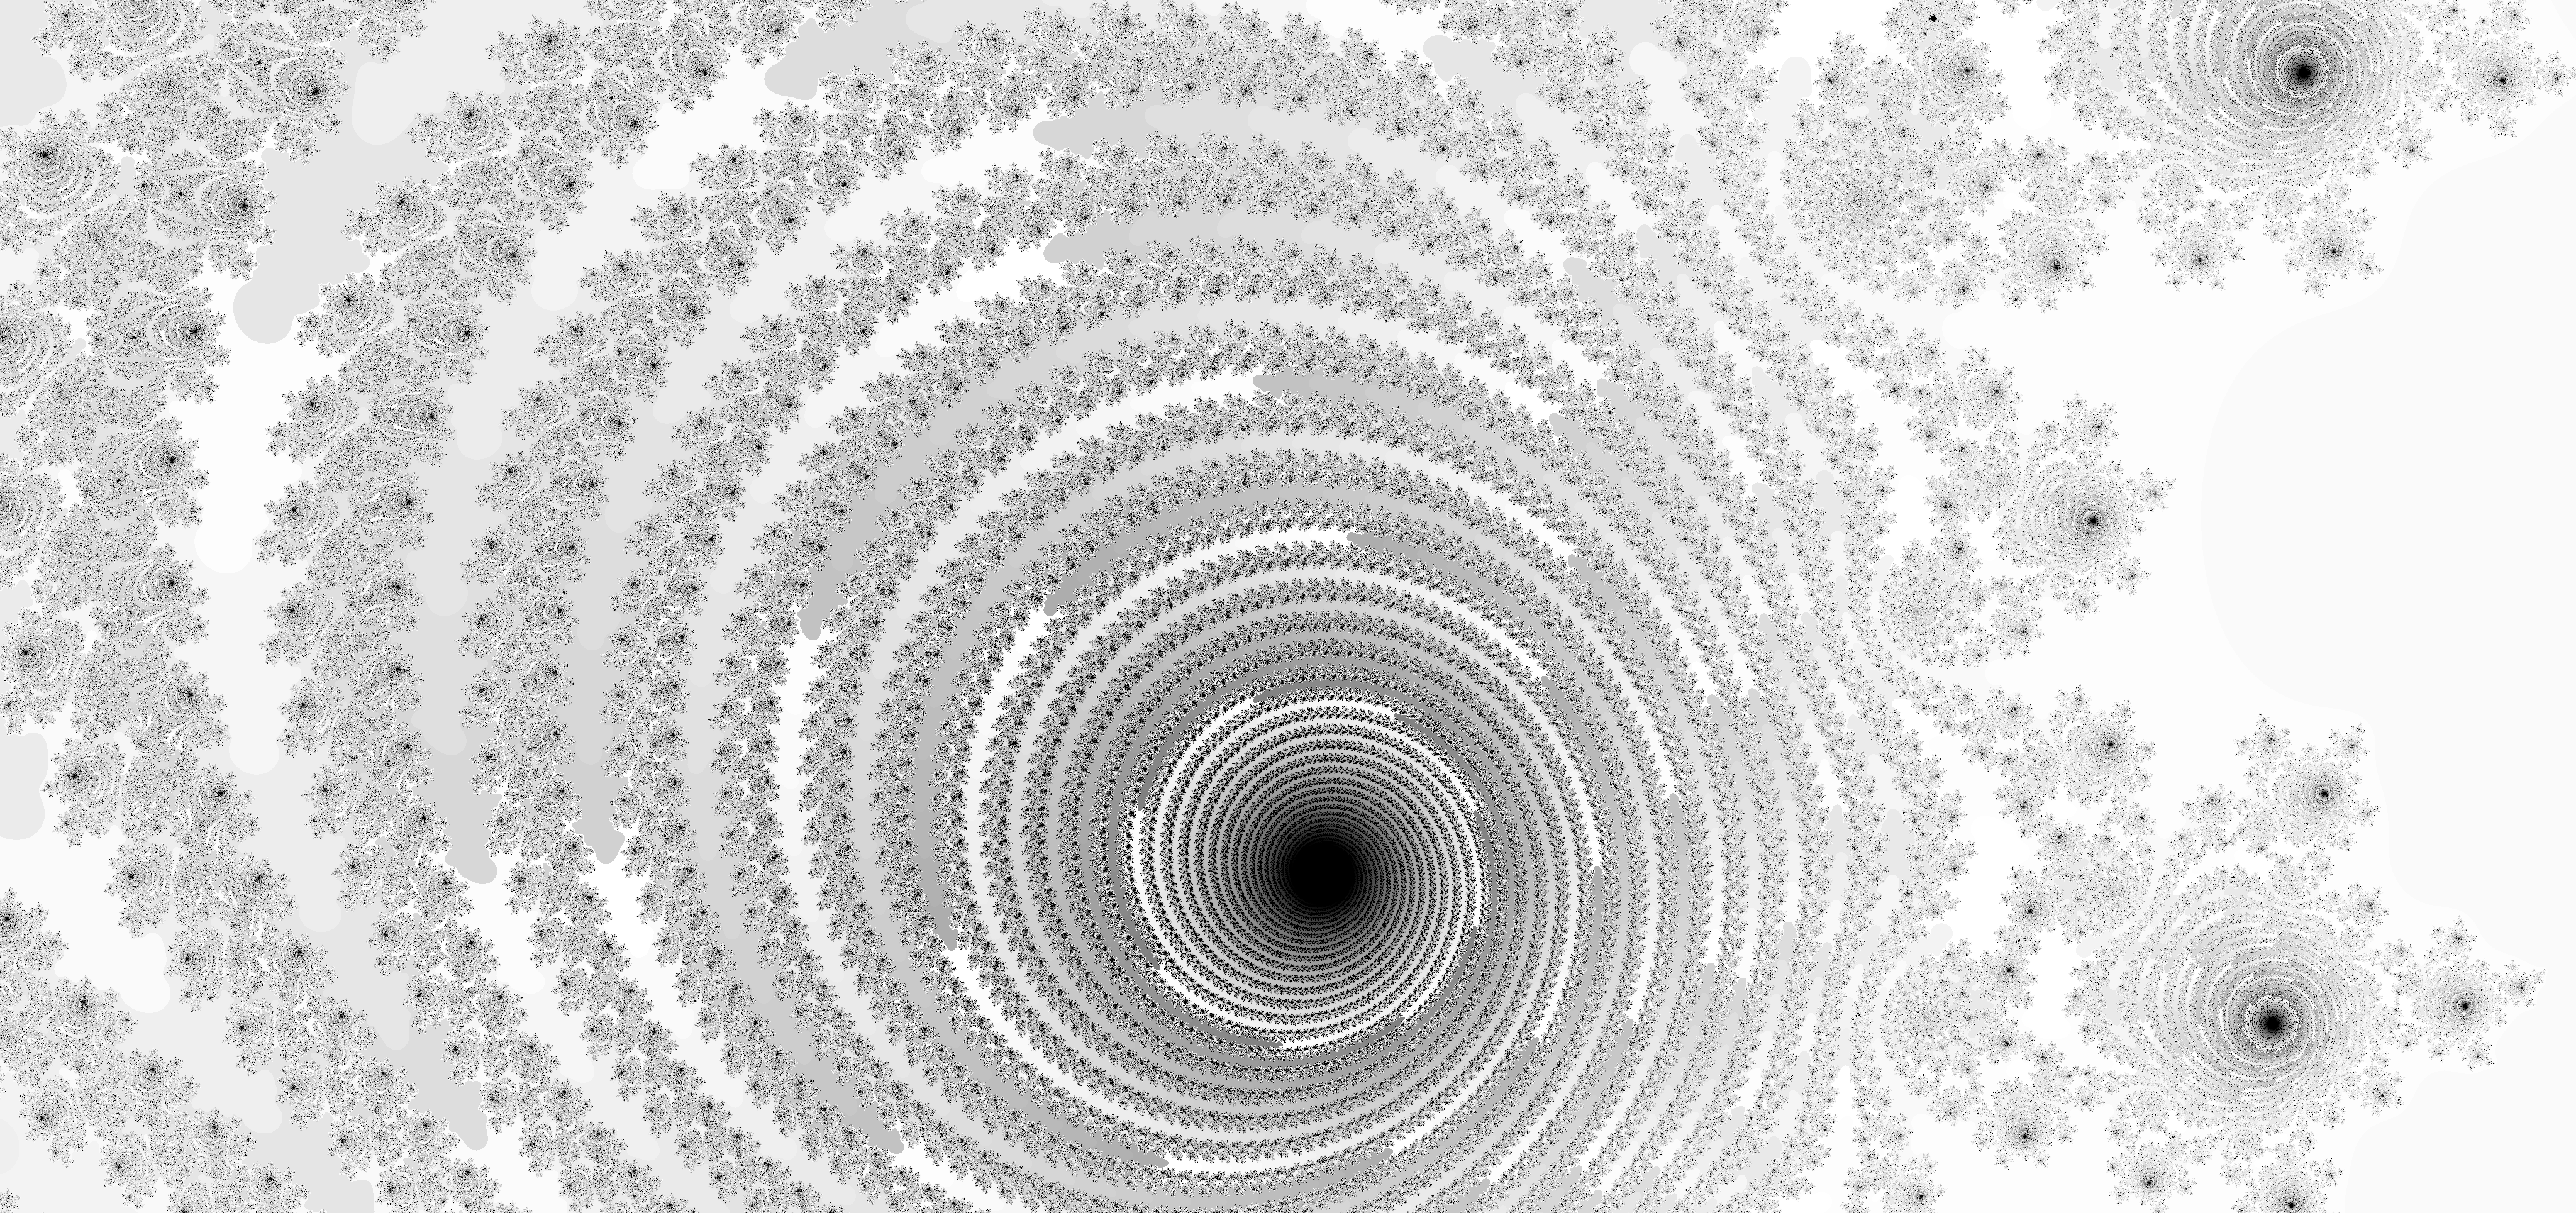
And also animations of zooming in within a specific region of the set, showing it’s infinite fractal depths.
The iteration limit plays an important role in illustrating details, too much and some of the complexity at the edges is harder to see, too little and the details of those structures aren’t defined at all.
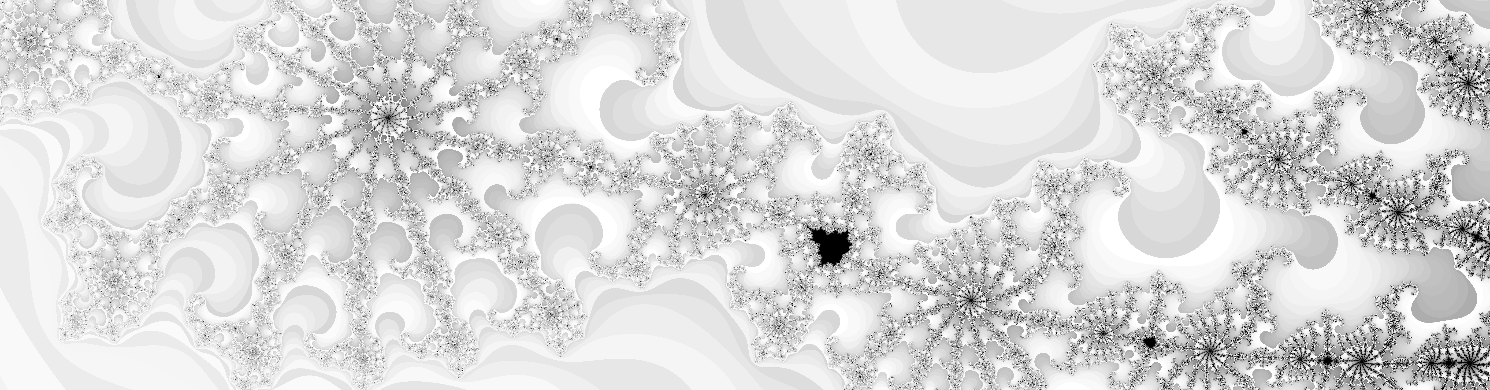
Here, we see a region with an iteration limit of 200.

And the same region again with an iteration limit of 4000.
Much of what we’d decided was not hyperbolic within 200 iterations is now revealed to also be full of regions of hyperbolicity.
I was happy with the code, so I published it. You can get the code here, but it’s not significantly different from the millions of other Mandelbrot set generators.
Chaos Game
The Chaos Game is a chaotic process, out of which complex order can emerge.
To play the game, first you pick set of 3 or more anchor points on some plane. Then you pick some starting point and a proportion (e.g. a half). Now we’re going to iterate.
At random, select one of the anchors and on the line between your current point and the anchor, move one proportion of the distance to it. Mark this location with a dot, this is your new location. This process is then repeated from the new location to a newly selected random anchor point.
Over time, with iteration, patterns emerge from the chaos.

While the choice of point locations is ultimately arbitrary, I opted pick a set of points all equally spaced from each other around some origin point by calculating roots of unity to give the most clear representation of the resulting forms. Given n points to pick, we pick a set of points such that xm=cos(2mπ/n) where m is the mth point of the n total points we wish to select, and similarly ym=sin(2mπ/n). e.g. the x for the 2nd root of 3 would be x2=cos(4π/3)=-1/2.
Now for each frame of the animation we will iterate and plot some number of points. Then for the next frame, we will start with a blank slate but a slightly increased proportion.
This gives us an animation where a fractal geometric shape looms out at us from the noise and then drifts into the distance.

We see a Sierpinski Triangle here, with 3 points chosen.

With 6 points we have a hexagon.

With 8, unsurprisingly, an octagon.

And finally, a dodecagon for 12 points.
An added bonus of writing your own tooling, is that you can make it do things that no existing tool is designed too (maybe for good reason!) and you can kind of go a bit crazy with it.
I’ve published the code for this, and it is available here.